reports/shap_summary.json
What the model uses, not why someone left.
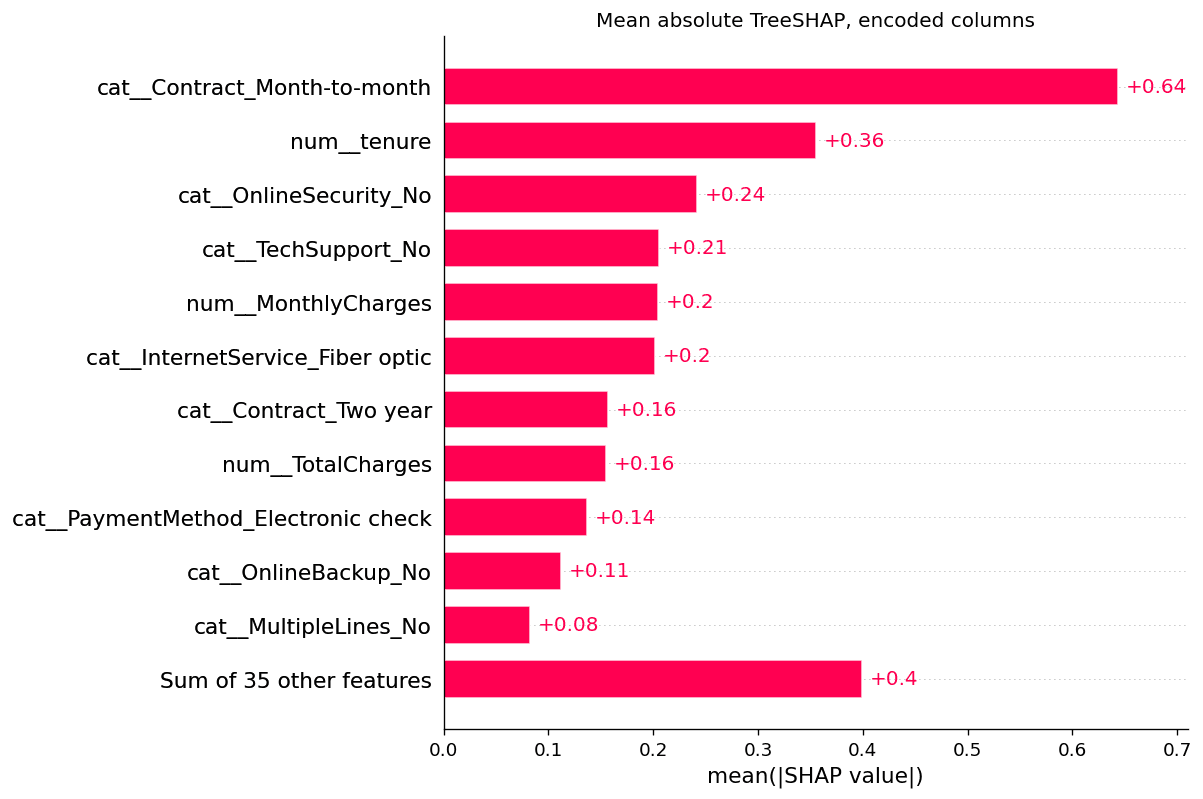
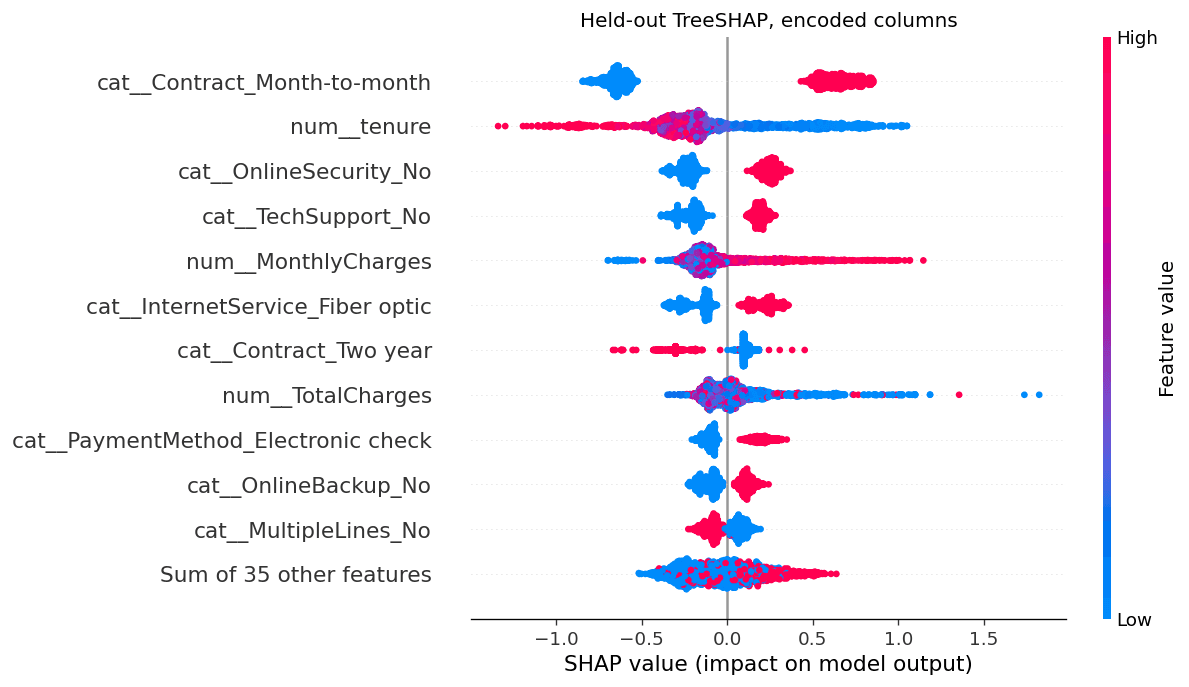
shap.TreeExplainer on the gradient-boosting classifier inside the saved pipeline. Output units: decision_function log-odds of P(Churn=Yes). On 1761 held-out rows the values plus the base value -1.556380 rebuild decision_function with max absolute error 0.000000.
Turn a local contribution off in the demo. The figures below stay on the published values.
Global
one-hot and scaled columns seen by the booster. 46 encoded columns. Mean absolute SHAP of an original field is the sum of the mean absolute SHAP of its encoded columns.
| Encoded column | Mean absolute SHAP |
|---|---|
| cat__Contract_Month-to-month | 0.643924 |
| num__tenure | 0.355529 |
| cat__OnlineSecurity_No | 0.241598 |
| Original field | Mean absolute SHAP | Value |
|---|---|---|
| Contract | 0.837003 | |
| tenure | 0.355529 | |
| OnlineSecurity | 0.241598 | |
| TechSupport | 0.212835 | |
| MonthlyCharges | 0.204335 | |
| InternetService | 0.201518 | |
| TotalCharges | 0.155191 | |
| PaymentMethod | 0.141521 | |
| SeniorCitizen | 0.044300 | |
| gender | 0.019143 |
gender and SeniorCitizen are listed after the eight largest original fields so their mean absolute SHAP can be read on the same scale. They are not a second measurement.
Three held-out customers
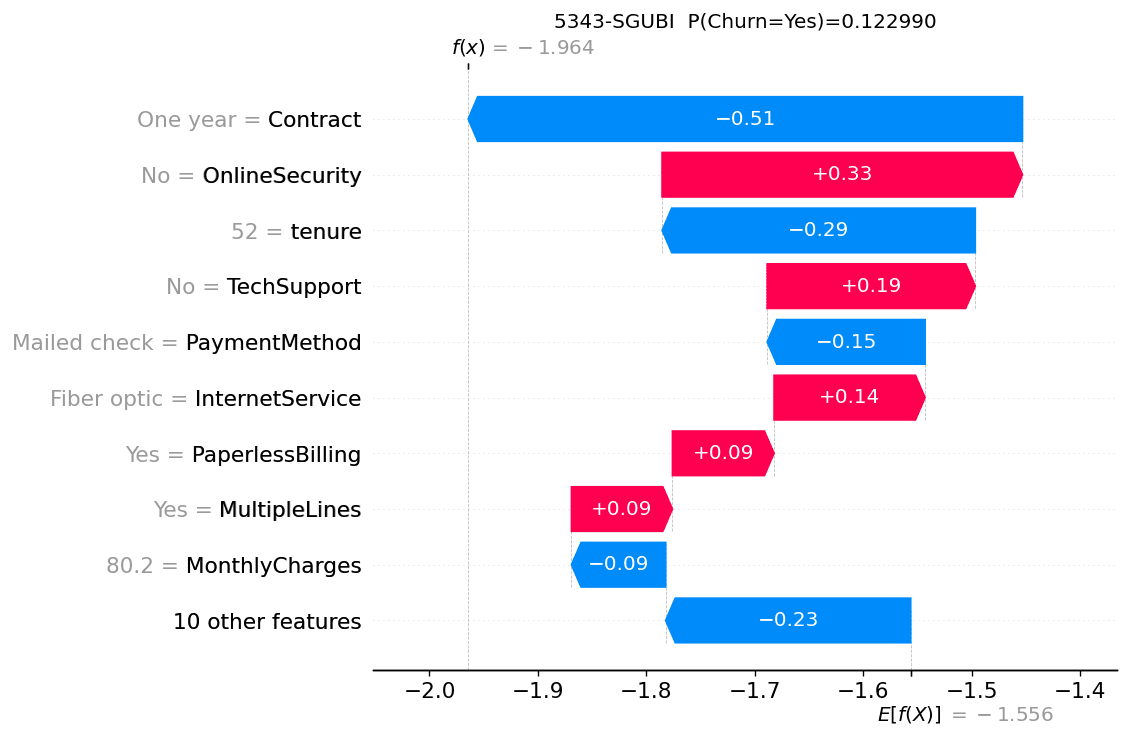
Signed SHAP values summed within each original field. The plot label is field=raw value. The plotted bar is not a causal effect.
5343-SGUBI
P(Churn=Yes) 0.122990. Historical Churn No. Decision function -1.964413. SHAP base value -1.556380. SHAP sum -0.408033.
Positive SHAP raises the model's log-odds of churn.Negative SHAP lowers them. The bar is not a cause.


| Customer | Why this row | Historical Churn | P(Churn=Yes) | Largest original field |
|---|---|---|---|---|
| 5343-SGUBI | First held-out row with numeric TotalCharges | No | 0.122990 | Contract = One year, -0.511087 |
| 0295-PPHDO | Highest held-out probability | Yes | 0.924460 | Contract = Month-to-month, 0.870800 |
| 5787-KXGIY | Lowest held-out probability | No | 0.006431 | Contract = Two year, -0.886617 |