reports/fairness.json
A measurement, not a certificate.
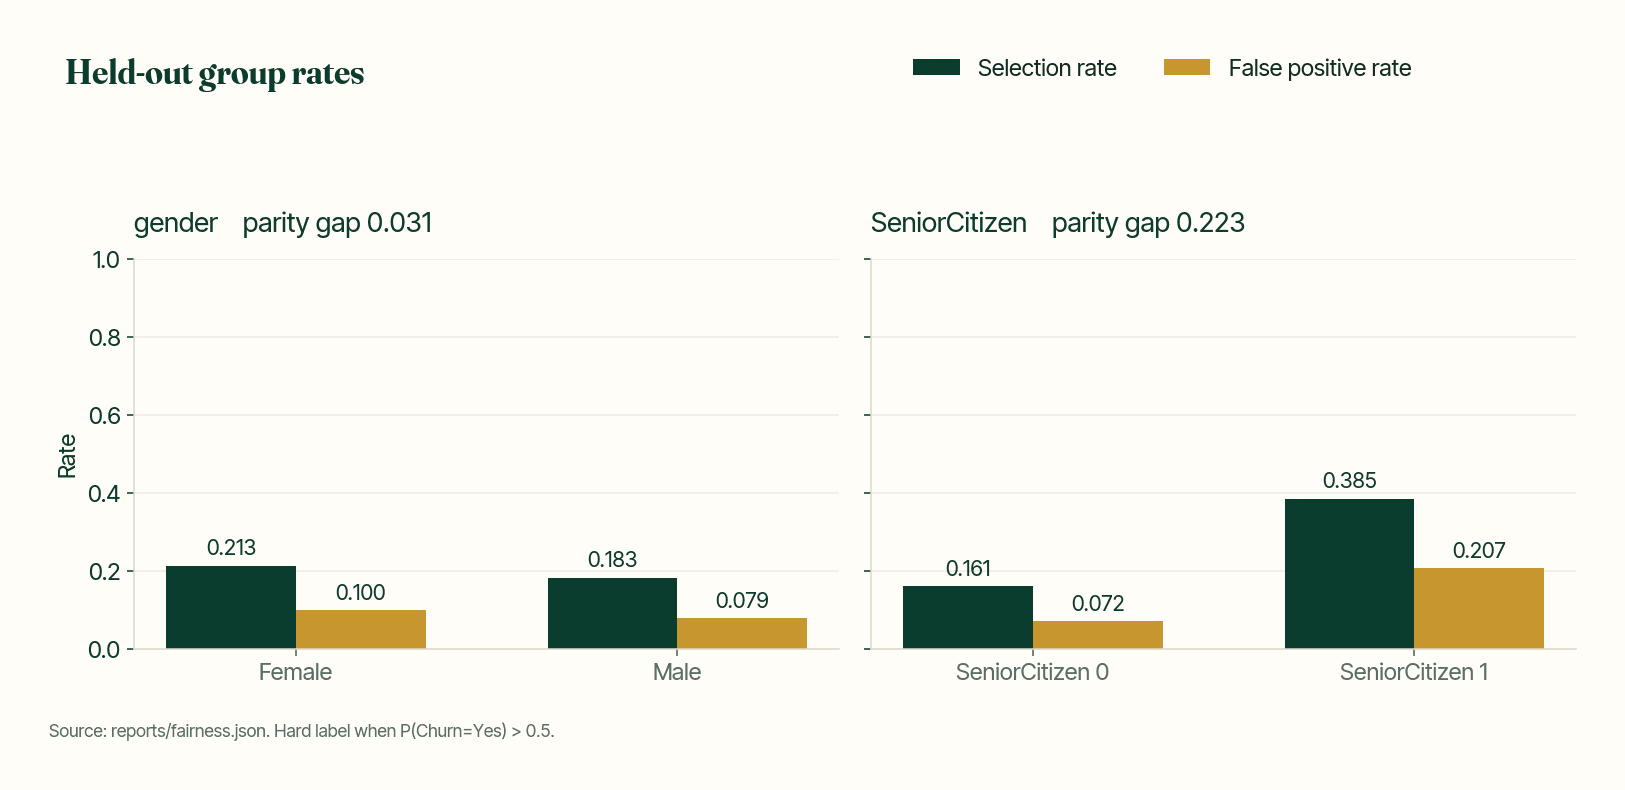
Demographic parity difference is 0.223259 for SeniorCitizen and 0.030582 for gender. Both fields are model inputs. This is one split and one cutoff.
Not a fairness certificate
Move this cutoff in the demo. The tables below stay on the published threshold.
Published differences
Absolute difference between the largest and smallest group selection rates, as returned by fairlearn.metrics.demographic_parity_difference.
The larger of the absolute true-positive-rate gap and the absolute false-positive-rate gap across groups, as returned by fairlearn.metrics.equalized_odds_difference.
gender
Equalized odds difference 0.020532. Mean absolute SHAP for this original field is 0.019143.
Female (n=863, label rate 0.278100) and Male (n=898, label rate 0.252784) are close on selection rate (0.213210 and 0.182628), true positive rate (0.508333 and 0.488987), false positive rate (0.099518 and 0.078987), and ROC-AUC (0.839811 and 0.851937).
Source: reports/fairness.json and the mean absolute SHAP rows in reports/shap_summary.json
Group rates
Overall, 467 of 1761 held-out rows are positive (rate 0.265190). The selection rate at this cutoff is 0.197615.
Positive when the saved pipeline's predict() returns class 1, which is when P(Churn=Yes) > 0.5. An exact tie stays class 0.
P(Churn=Yes) from predict_proba, not the hard label.
| Group | n | Label rate | Selection rate | TPR | FPR | ROC-AUC |
|---|---|---|---|---|---|---|
| Female | 863 | 0.278100 | 0.213210 | 0.508333 | 0.099518 | 0.839811 |
| Male | 898 | 0.252784 | 0.182628 | 0.488987 | 0.078987 | 0.851937 |
| SeniorCitizen 0 | 1475 | 0.233898 | 0.161356 | 0.455072 | 0.071681 | 0.845995 |
| SeniorCitizen 1 | 286 | 0.426573 | 0.384615 | 0.622951 | 0.207317 | 0.800680 |